Emergency Medical Service Spatiotemporal Prediction Model
Where and When? Predicting Emergency Medical Service Demands through Spatial-Temporal Graph Convolutional Networks
Emergency Medical Services (EMS) are critical in safeguarding public health through timely emergency care. However, EMS demand varies significantly across time and space due to population density, traffic patterns, and regional infrastructure. This study develops a spatiotemporal predictive model to optimize EMS resource allocation by integrating both dynamics. The study analyzed EMS call data of 27,989 cases from Jeollabuk-do, South Korea during January-December 2023, using Spatial-Temporal Graph Convolutional Networks (ST-GCN) to predict patterns across rescue units, safety centers, and local stations. The model predicted call frequency, response time, and travel speed, followed by K-means clustering to identify regional vulnerability patterns. ST-GCN predictions revealed distinct center-specific patterns, with rescue units showing concentrated activity during night hours while safety centers were busiest during daytime. High-demand clusters were concentrated in urban centers, with demand spreading to satellite cities, while rural areas showed lower frequency but longer response times due to distance. K-means clustering based on both averages and variability identified four distinct regional patterns: stable rural areas, speed-unstable suburban regions, high-demand-volatile urban centers, and response-time-unstable remote areas. This study advances EMS resource optimization by demonstrating how integrated spatiotemporal modeling can improve service delivery. The findings support dynamic, data-driven resource allocation strategies and highlight the need for center-specific operational approaches.
Keywords: Emergency Medical Services, Spatiotemporal Prediction, Graph Neural Networks, Service Vulnerability, Regional Disparity
ST-GCN Prediction Results by Center Level
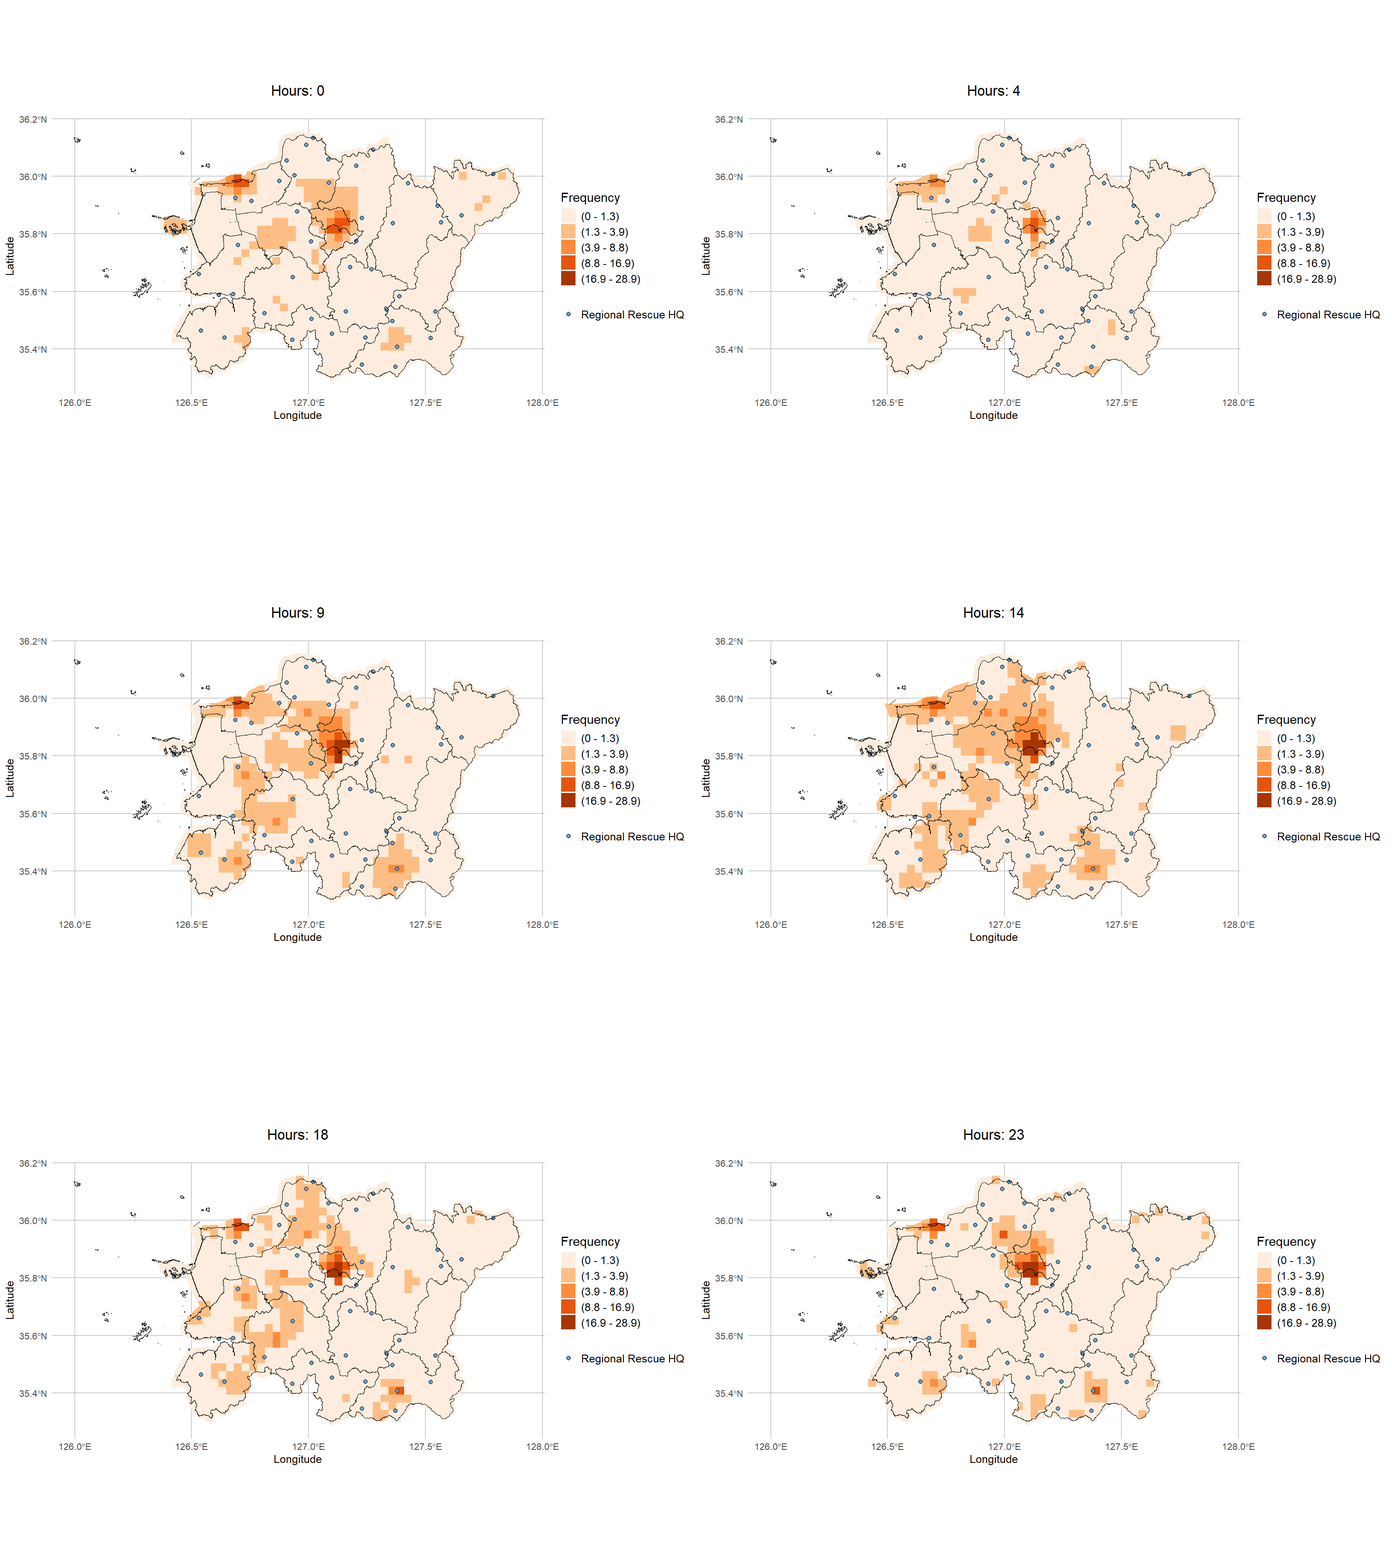
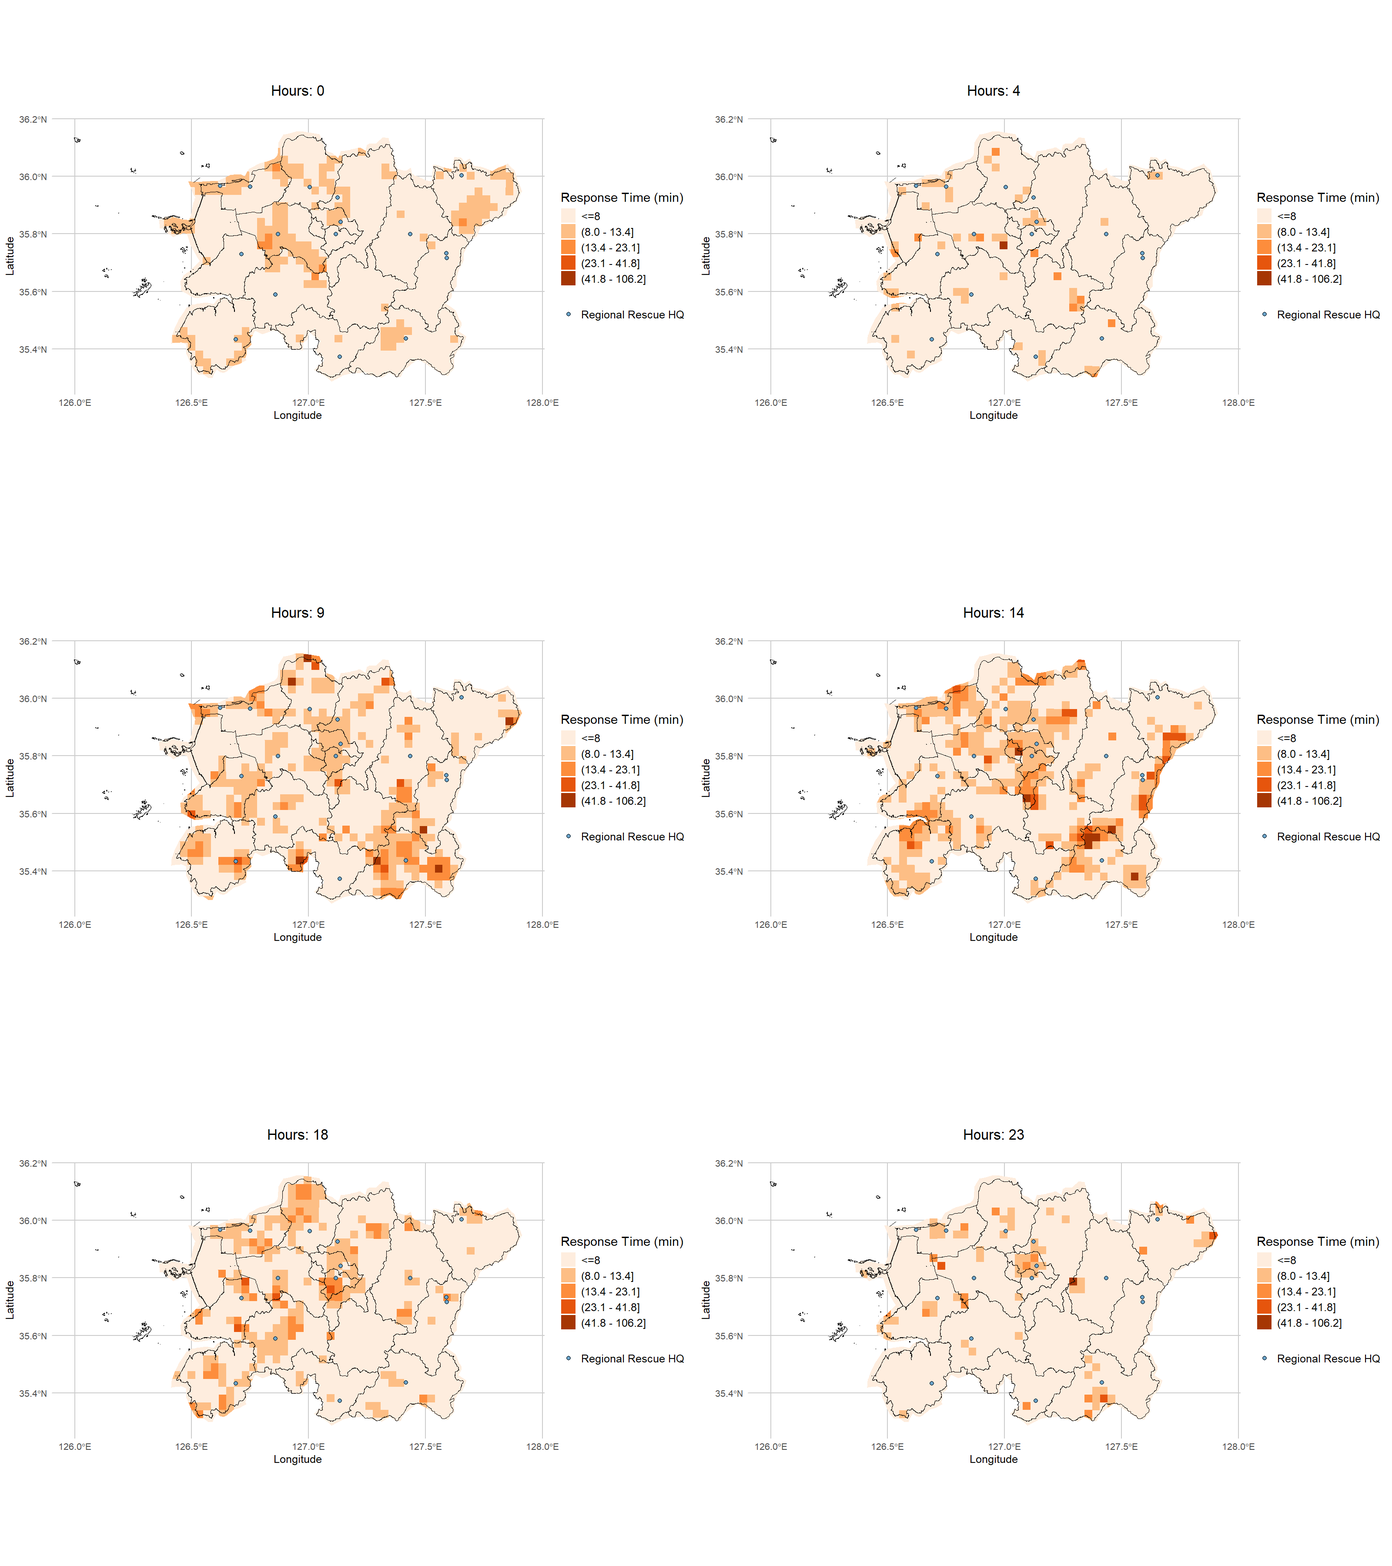
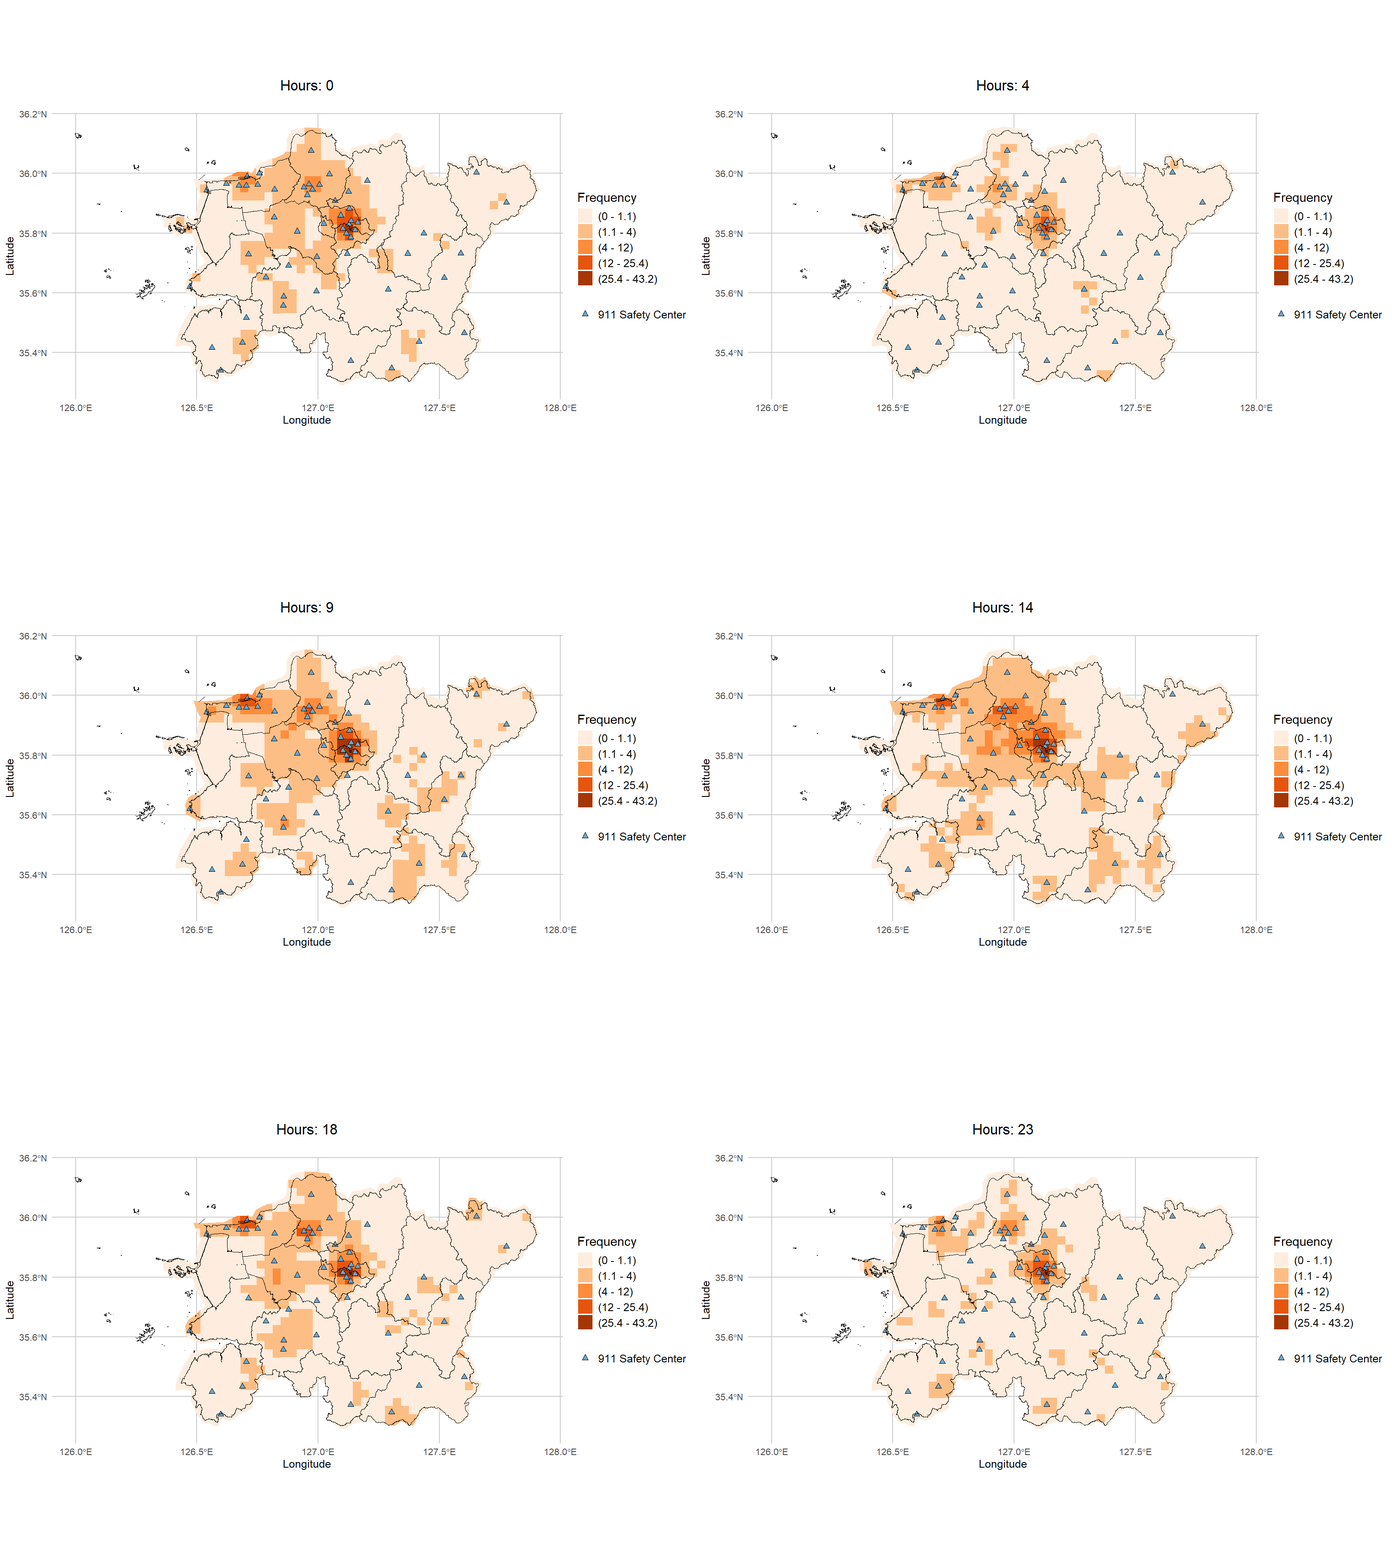
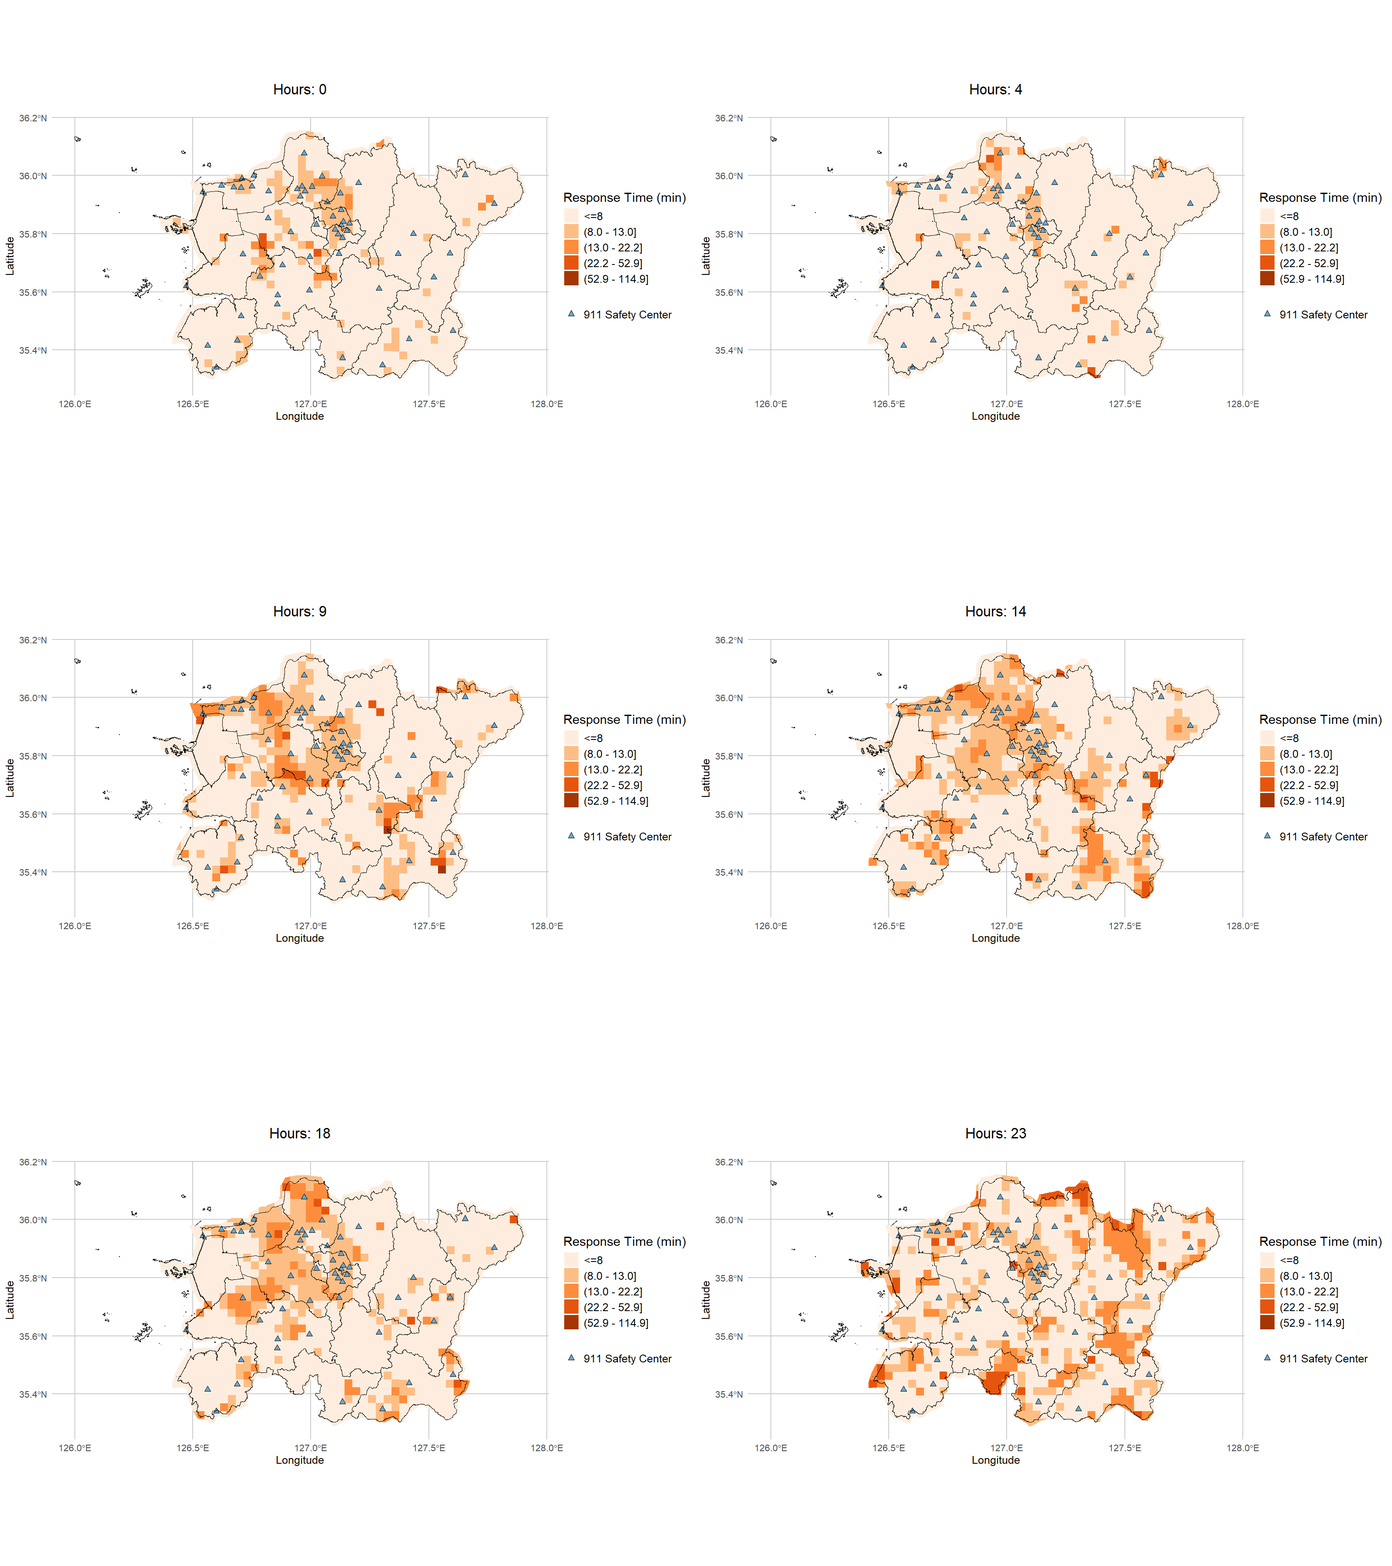
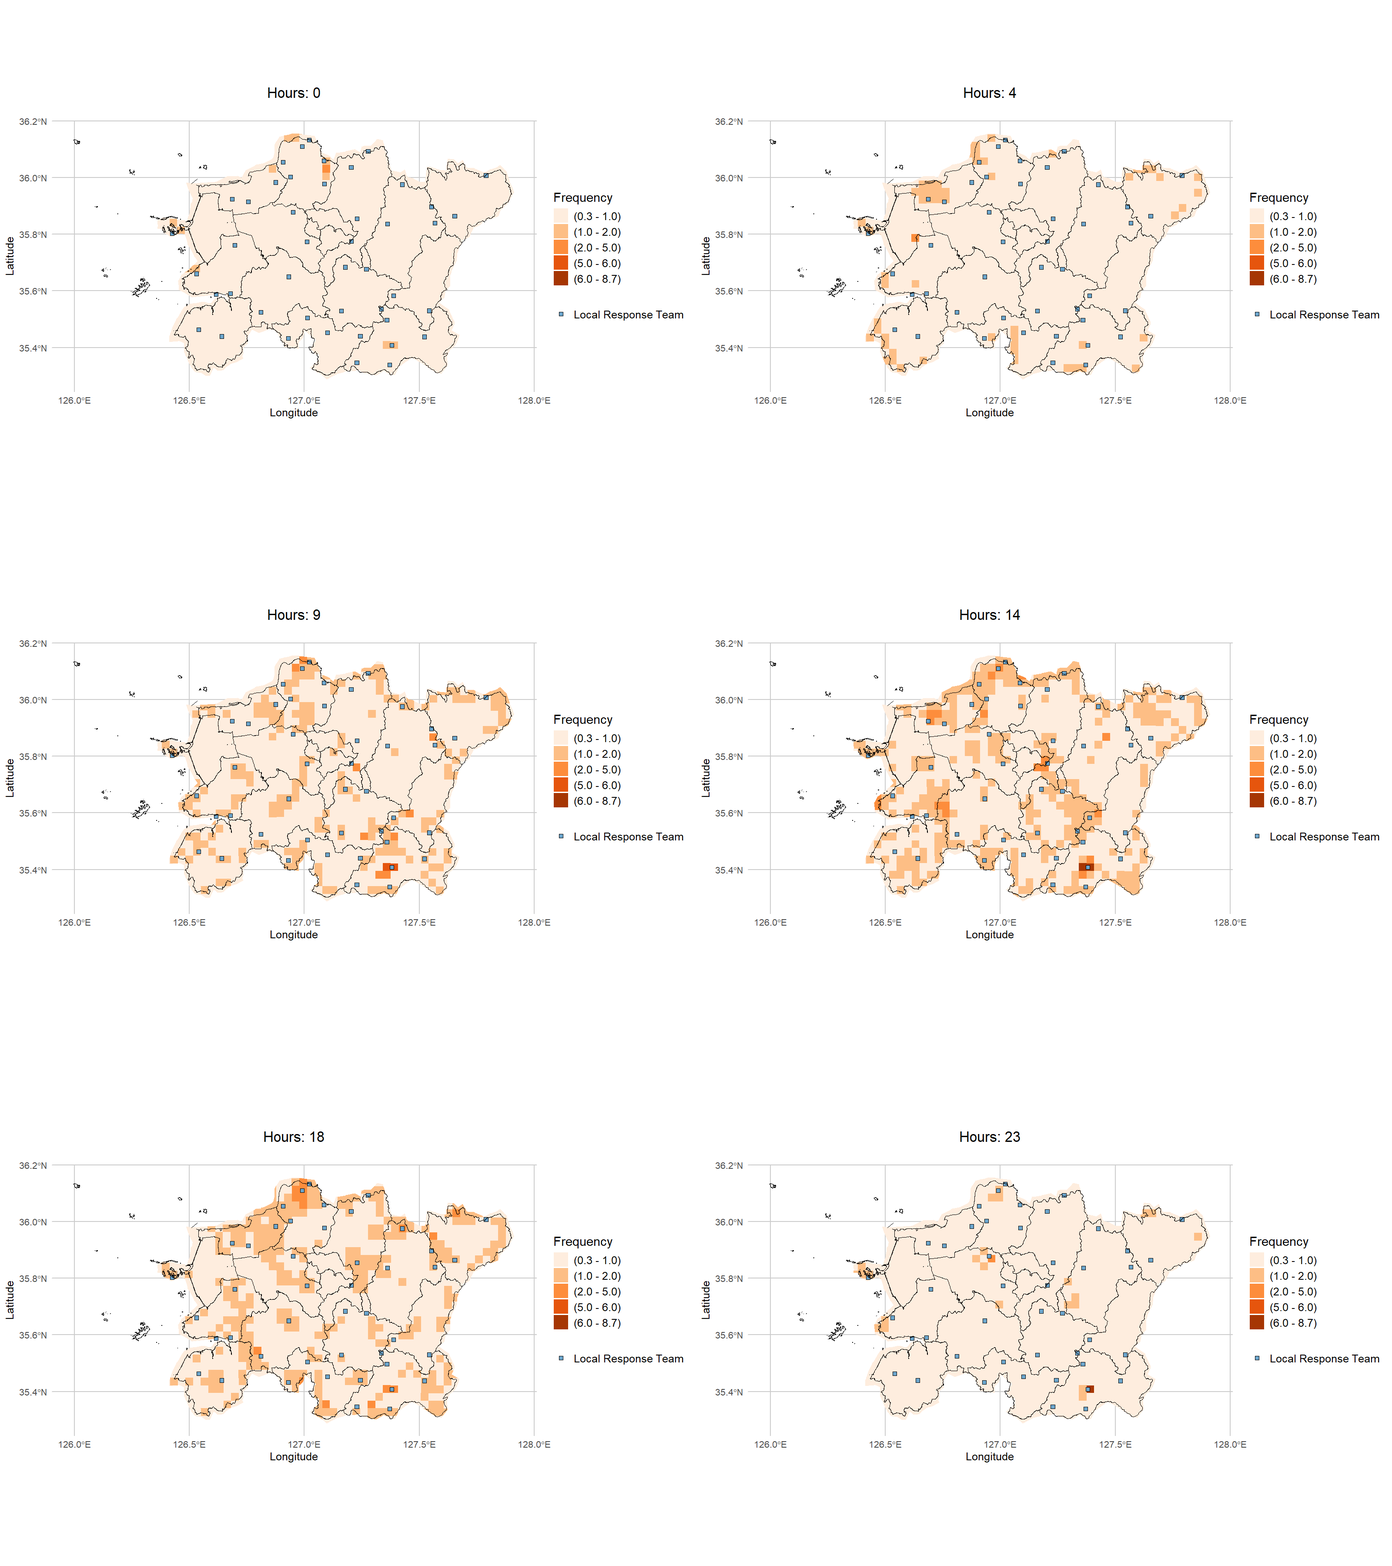
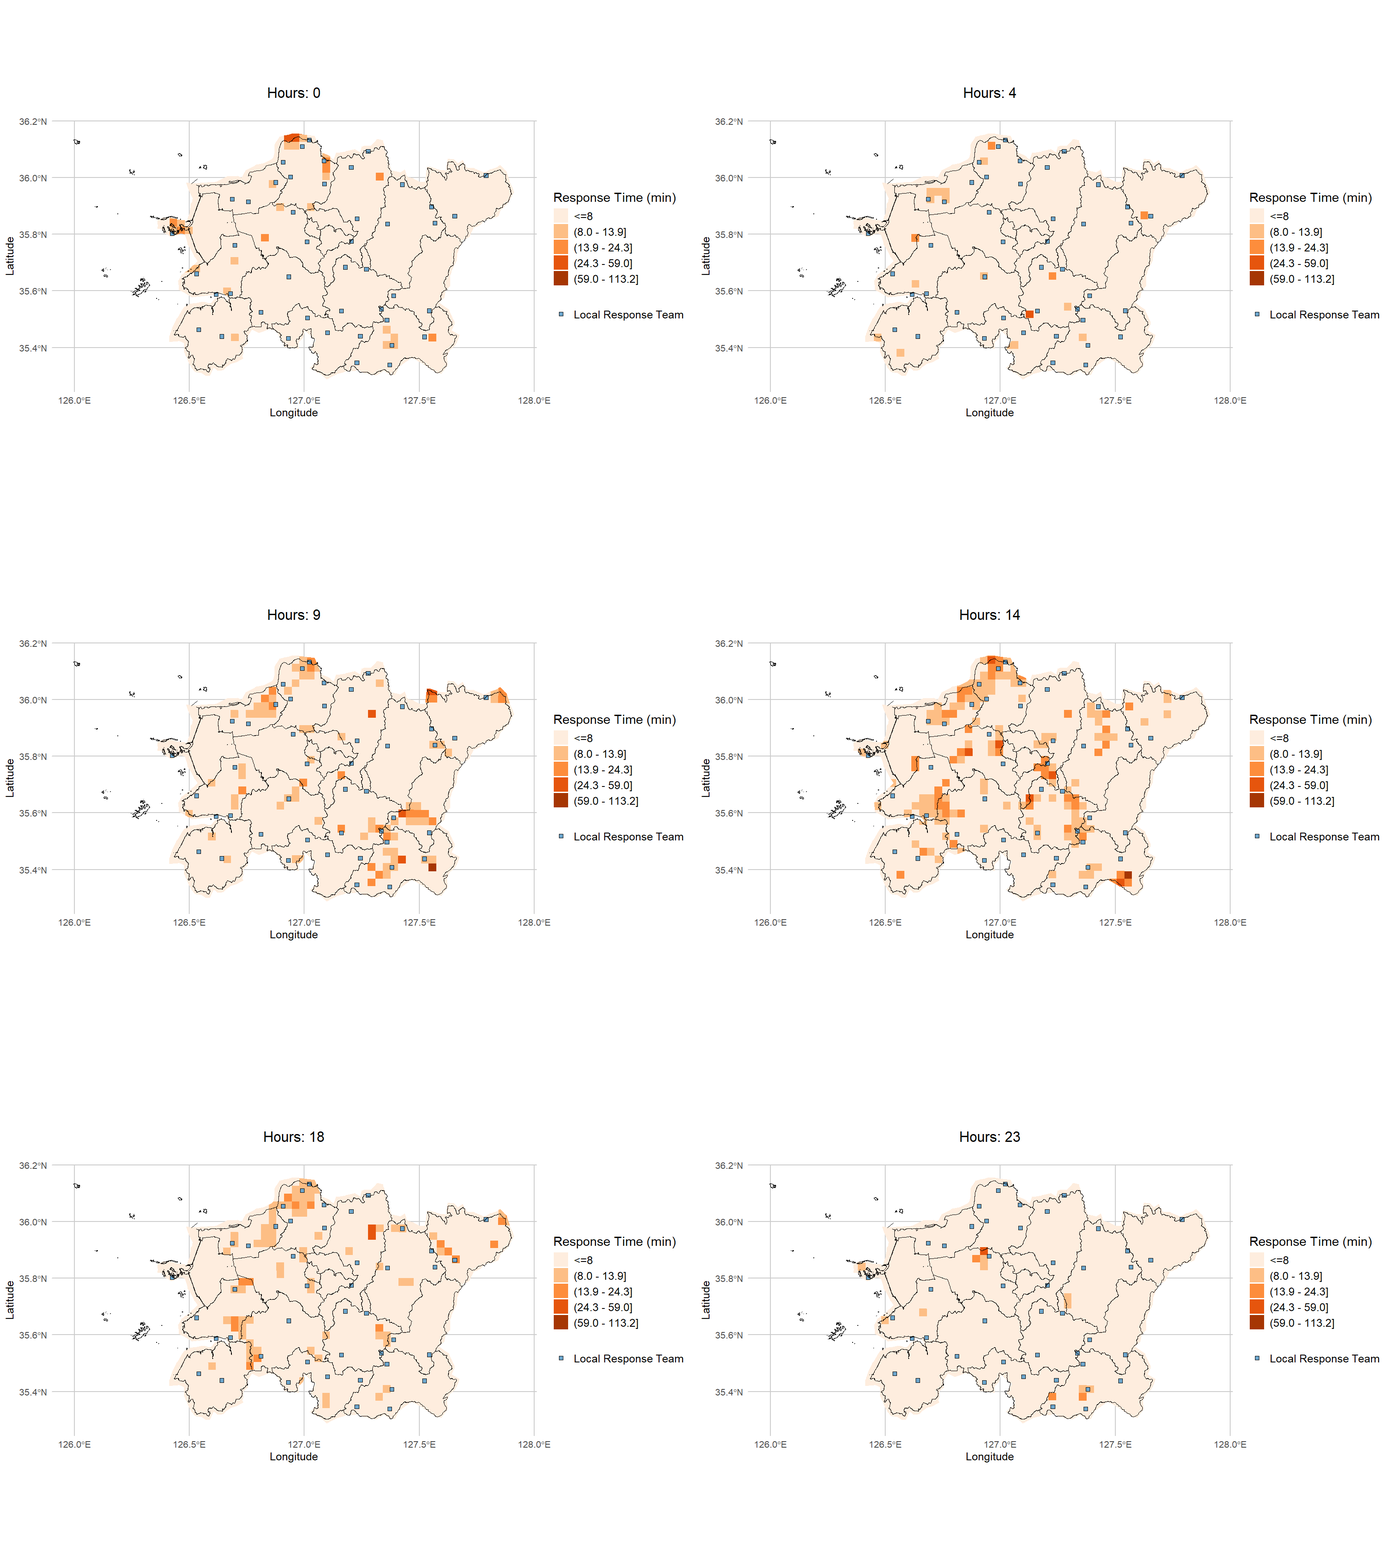
These animations present a timeline of predicted outcomes across regions in the study area, illustrating hourly variations from 0 (12 AM) to 23 (11 PM).
1) Regional Rescue HQ
| Predicted EMS Call Frequency |
|---|
 |
| Predicted Response Time (min) |
 |
2) 911 Safety Center
| Predicted EMS Call Frequency |
|---|
 |
| Predicted Response Time (min) |
 |
3) Local Response Team
| Predicted EMS Call Frequency |
|---|
 |
| Predicted Response Time (min) |
 |